

RELIGION IN AUSTRALIA
This is a piece of work done for a group of Australian churches. They were interested in exploring the deeper dynamics of changing religious profiles across the country ...
-
The percentage of Christians in Australia in 2016 was 52.1% (down from 61.1% in 2011).
-
This was a fall of 949,161 Christians despite a big increase in Australia's population.
-
The decrease is almost entirely the result of 2011 Christians changing their religion choice (generally to 'no religion') - not due to failed replacement of aging Christians.
-
Christians fell away in all age groups from Baby Boomers onwards, although heaviest among those around their twenties.
-
The young groups least likely to be Christians are Green (especially) and Labour voters, de facto couples, shared household members and males.
-
Christianity is most popular among females, conservatives, the very wealthy and those living in remote areas.
-
It is difficult to ascertain the impact of the changed structure of the census Religion question although in all likelihood its magnitude is only small part of the overall change.
Headlines over the last few days have told us how much Australia is losing interest in religion. Particular emphasis has been on Christianity - falling from 61.1% of the population to 52.1% in the five years between the 2011 and 2016 Censuses. It is not unusual for the Christianity percentage figure to fall - but the magnitude of this is startling. Furthermore it is the first time the person count of Christians has also fallen - down by 950,000 to 12.2 million.
It would be easy to ignore this and continue on. After all it is only numbers. Not so, on top of being a hefty warning these numbers provide great insight into how the church can engage better with society, learn from its weaknesses and sharpen its strengths. We ignore data at our peril and miss a great deal of opportunity.
So how do interpret these figures to move the church forward? First of all we must fully understand these results. With more Census data having been released by the ABS on the 4th of July we can now investigate this further.
Let's look at this 950,000 decline. 878,000 was among Australian born residents. It was not however the result of an aging Christian population that is failing to be replaced by youngsters. In fact Christians born in the last five years have more than counteracted Christians passing on (and emigrating) over the last five years (by 75,000). Instead there were 953,000 Australian-born people who identified as Christian in 2011 but did not in 2016. This is the crux of the problem. This compares to a drop of just 94,000 from 2006 to 2011 as the result of this same (negative) conversion.

Change via Population = changes caused by immigration, emigration, births & deaths
Change via Conversion = changes caused by selecting a different religion option
As part of this process Australian-born residents are separated out. This is so we can precisely track generations (without the 'noise' cause by immigration). Nonetheless, the same negative conversion is also happening among those born abroad with a drop of 389,000. Most of this was counteracted by the arrival of new Christian immigrants over the last five years.
We can therefore see that the decline in Christianity is driven by an active turning away (although the changing census question format has partly contributed to this). The detailed dynamics of this are summarised in the table below. The yellow section looks at changes from 2006 to 2011, the grey from 2011 to 2016. The overall change is split between change via population and via conversion. The top section looks at all residents - before splitting up in to those born in Australia and those born abroad.
Tracking Christians over Censuses (2006 to 2016):

It is now important to pinpoint any groups of the population where the decline is strongest. The most obvious place to begin is comparing generations. As we can track the religion of Australia born residents by each Census (as an aggregate, not individually) we follow how different generations are interacting with religion as their lives go on.
This can be seen below comparing the responses given in 2016 with those in 2011 (for each birth year group). We can see that there are very high levels of conversion from Christianity for those born between 1987 and 2001 (those now aged between 15 and 30 years old). The red (and pink) shows the net conversion from Christianity over the last 5 years ('gains' less 'loses'). This peaks for those born between 1992 and 1996 where over 214,000 were Christians in 2011 but no longer in 2016. This grouped was topped up a little by immigrating Christians. Nonetheless, this is clearly a major area of concern.

This negative conversion is also occurring within older generations right back to baby-boomers - albeit at reduced levels. This is unusual given this has not occurred historically. This is demonstrated on the identical chart below but from five years back (2006 v 2011). We can only speculate how much of this is a result of the changed Religion question format. It would be too easy an excuse to attribute too much of the fall on this.

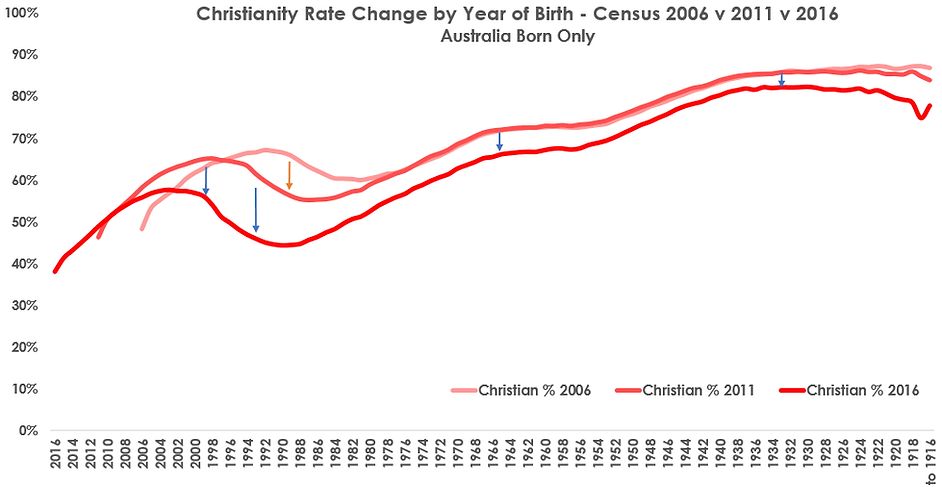
We should not forget it is reasonably 'normal' for Christians to fall away around their twenties - this is seen in both charts above. The magnitude of this is the main concern however. Below we see another view of this, comparing the Christian percentage for Australia born residents by year of birth - from the 2006 Census to the 2011 Census to the 2016 Census.
With more detailed data we can drill further into more precise groups where this conversion may be occurring most. This will not only help uncover the reasons for decline but also help derive strategies to counteract these trends.
I have again looked at just those born in Australia (in part for analytical robustness). I have also focused on those currently in their twenties (born between 1987 and 1997) as this is the greatest area of concern whilst the fixed aged group nullifies generational biases in the data.
The attribute that most predicts a non-Christian is those whose closest polling booth had a Green candidate winner in the 2016 federal election. This is based on granular census data and looking at vote counts at the nearest voting location. What is most astounding about this is that it does not necessarily mean a person voted Green (maybe just their neighbours). Therefore if we were able to filter by just those who did vote Green (we can't!) there would be an even lower Christian percentage (probably well under 20%). This is because the 24.5% includes non-Green voters (sorry, hard to explain in one sentence). This 2% group size (of the population) is likewise too low as Green voting levels are generally higher. Labour voters will also subject to this same trend so the 45.4% figure shown is again probably much lower in reality for actual voters. This immediately suggests Christianity is far less impacting for left-leaning individuals. This is unsurprising given the topics of a lot of church related media.
Christianity is also weaker among de facto couples (both different and same sex) and interestingly those living in group households (shared houses). Student areas are also low (which overlaps with group households).
The most economically challenged are also less likely to be Christians - see also the later chart on this.
Those most likely to be Christians are married couples (remember we are just looking at those in their twenties) along with females and right-leaning voters. Those of South and Eastern European ancestry are very likely to be Christian although this is a small group.
Although I have focused here on young Australia born people, these trends are very similar for other groups, particularly the same overseas born group.

As previously mentioned, income does have an impact on Christianity. This is not a strong relationship (relative to other variables) but interesting all the same. It can be seen below that those of the lowest socio-economic wellbeing are least likely to be Christian. Christianity has a peak at two points (for this segment of the population). Firstly at mid-levels of wealth at a SEIFA deciles of 5 or 6. The peak Christian rate is however at the highest levels of wealth - the top decile. The Christianity penetration at this level is 48.8% of Australia born twenty-somethings. Note that the SEIFA figures are still 2011 data (although this will not change significantly for 2016).

Rates of Christianity also vary significantly by region - as we also saw in the previous analysis. It not only varies by state but also by metropolitan versus regional/rural areas. This can be driven by the differing weightings of the factors (e.g. a high Green impact) and also the uniqueness of the given location. Regional NSW has the highest Christian percentage among the selected group. Hobart on the other hand has a very low rate of 34.0% - very much an outlier relative to the other locations.

Bringing these things together we can start getting a clearer picture on the levers which are pushing down the Christianity rate in Australia. There are particular problems with those in their twenties and sub-segments within this group. A priority of the church going forward must be to stem this flow and working towards ensuring the next generation (those currently in their teens) are not subject to the same levels of retrenchment in Christianity.
These learnings (and more which will follow in additional analysis) can help drive strategic initiatives, both at a regional/state/national level and also at the local level. At the larger level leadership should be thinking about ways the church and the various denominations can connect with the different segments of the community which are currently disconnected from the church. There are no easy answers and a lot of soul searching will be required. The excellent qualitative research completed by McCrindle gives fantastic insight to the barriers existing within different parts of society.
At the local level a good understanding of the local community is required and likewise finding the best ways to connect. The tool below is a useful start and gives details of each statistical area (seen by hovering over each dot - each dot represents an SA1 area [about 400-500 people]). Green coloured dots represent areas of high Christianity, red is low Christianity (the size of the dot is the SA1 population). You can drill in and out and move around as required.
This second map below reverts to postcode level. It looks at the most common religion in the postcode - these being represented by the colour in the key. By hovering over each dot the entire religion mix can be seen for that postcode and comparisons with 2011.
Hovered figures:
Count In 2016 (% in 2016) < (% in 2011) % Change
In summary, it can be seen many issues face the church. The fact that these issues are centred around young people is of special concern. There appears to be one group in particular which is being overlooked and that is the young (and young at heart) who tend to be more liberal minded and leaning to the left. Churches must look to find ways to engage this group, as well as others, to show that Christianity is relevant to all people. My reflection is that this group looks very similar to those people who nearly elected Sanders and Corbyn, and as this generation rises the church must look to be at the forefront of it.